Seafood
Mackerel
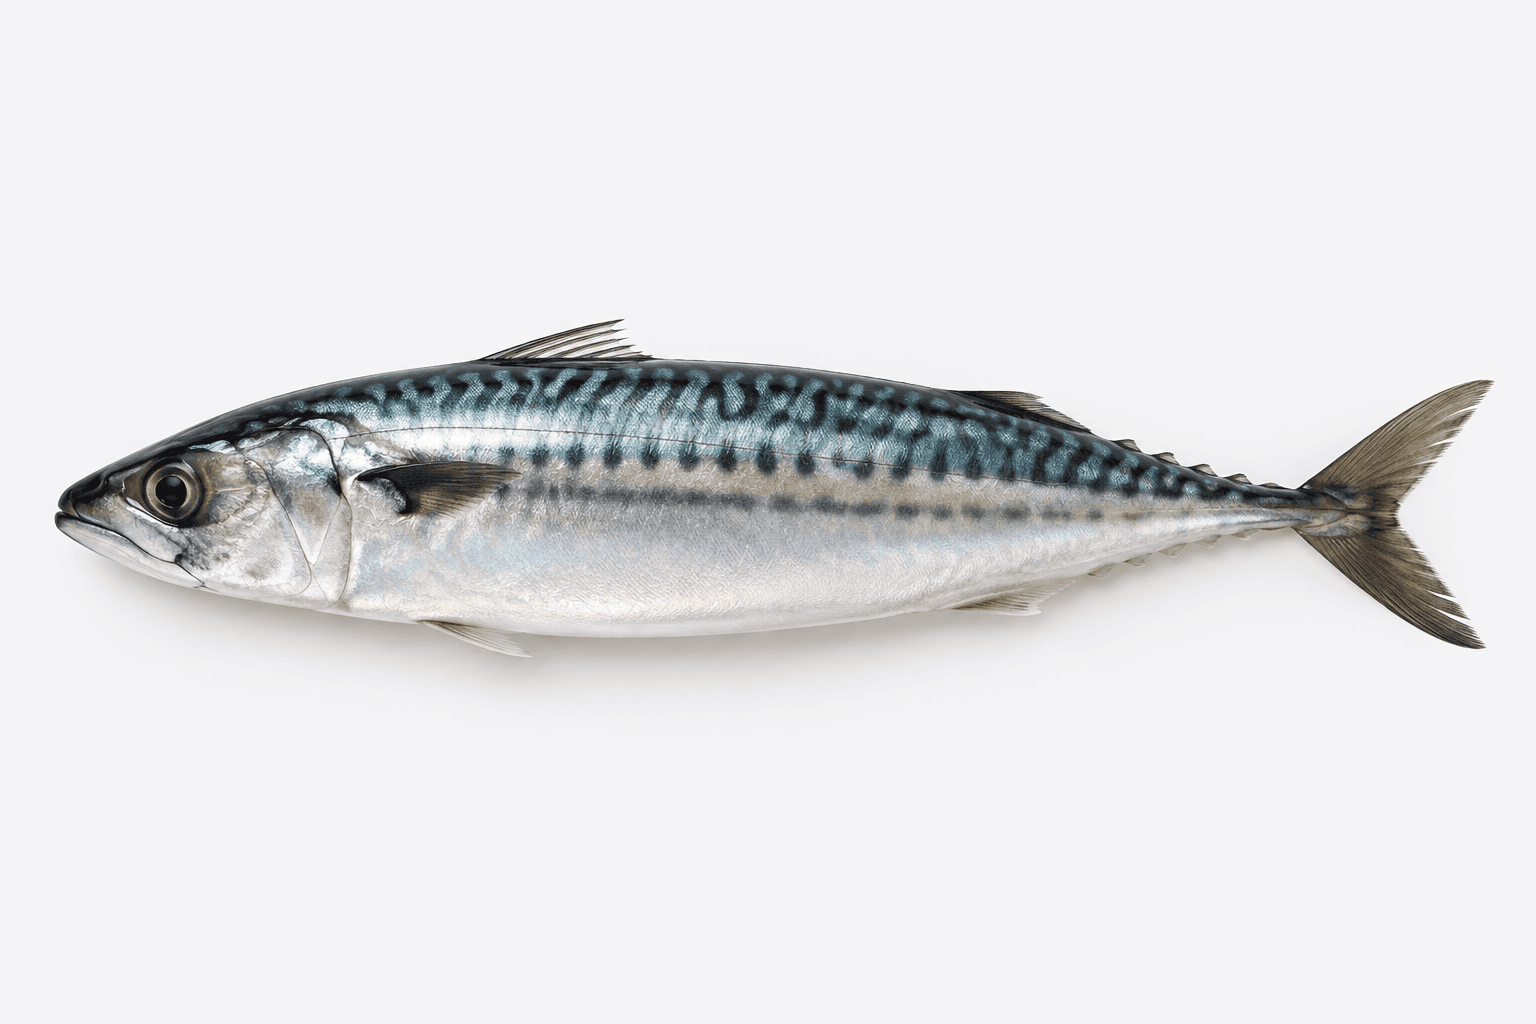
100 g of mackerel carries more EPA and DHA than salmon. Factor in the price and it is the best-value omega-3 fish there is.
The sardine's 382 mg of calcium comes from eating the bones, and the mackerel table has no calcium row at all. But one is a fish and the other is a can.
Seafood
100 g of mackerel carries more EPA and DHA than salmon. Factor in the price and it is the best-value omega-3 fish there is.
Seafood
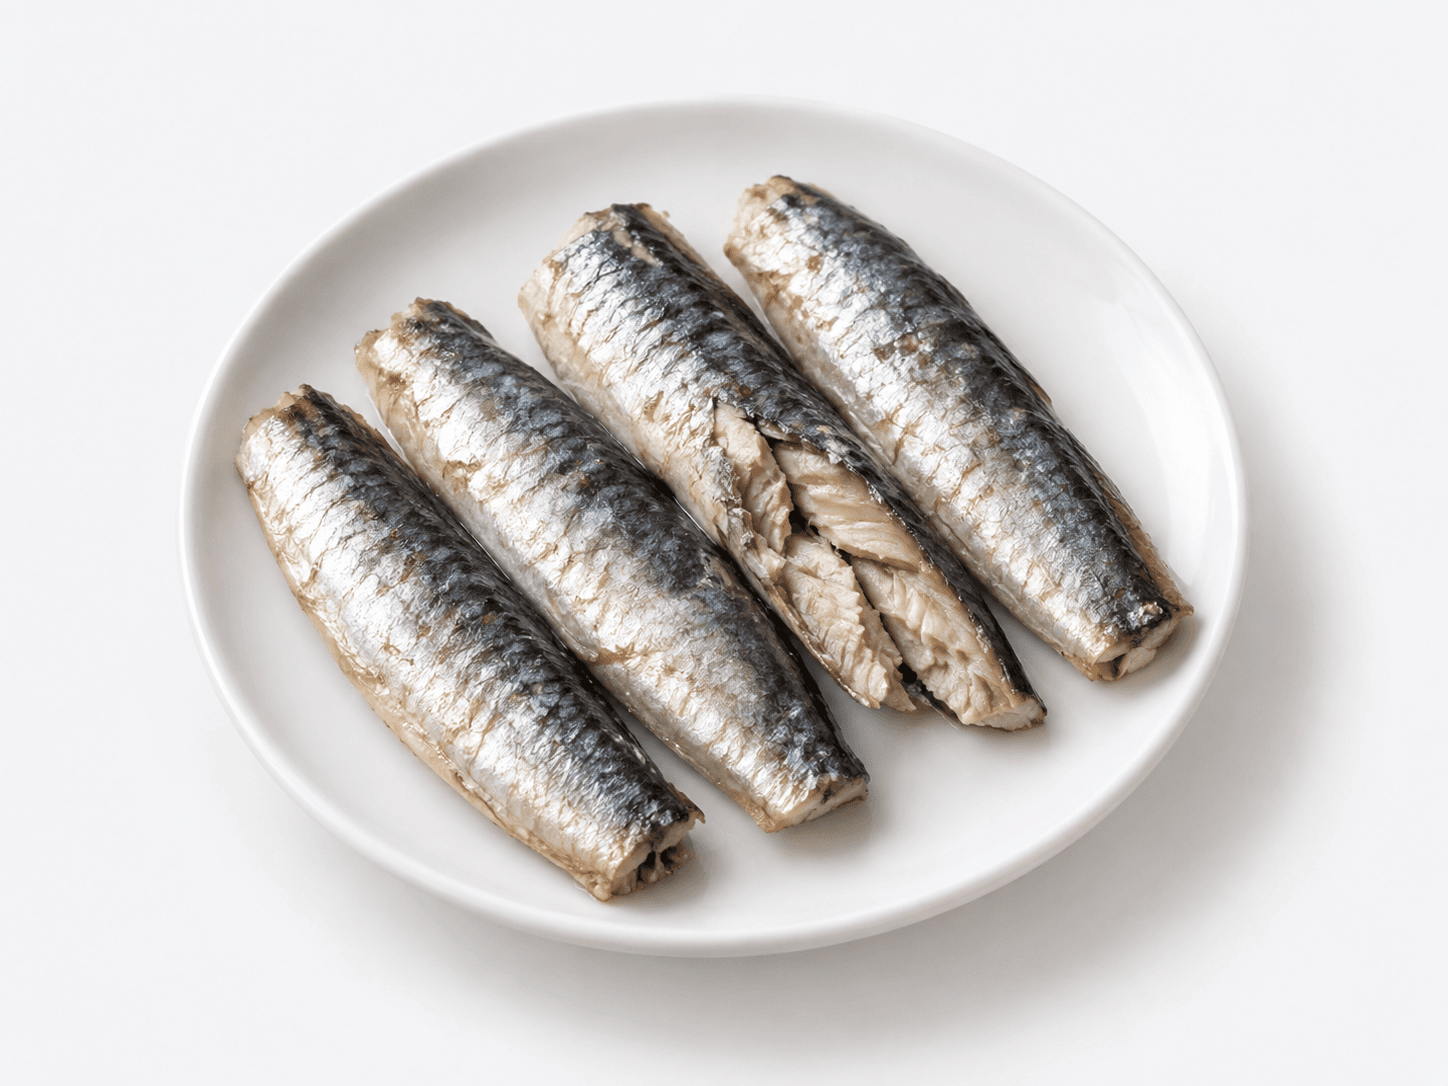
382 mg of calcium, 4.8 µg of vitamin D and 0.98 g of omega-3 per 100 g of tinned sardines. Being a small fish, it also carries little mercury.
Mackerel — Leads on
Sardines — Leads on
Per 100 g edible portion. Only rows where both have a figure are shown, and no winner is marked for items like calories or sugars where more is not better.
Basis for these figures
| Nutrition | Mackerel | Sardines |
|---|---|---|
| Calories | 205 kcal | 208 kcal |
| Protein | 18.6 g | 24.6 g |
| Fat | 13.9 g | 11.4 g |
| Omega-3 | 2.6 g | 0.98 g |
| Vitamin D | 16 µg | 4.8 µg |
| Vitamin B12 | 8.7 µg | 8.9 µg |
| Selenium | 44 µg | 52.7 µg |
The bases differ here. Mackerel is raw Atlantic mackerel; sardine is canned in oil, drained, with the bones included. It looks like a fish-to-fish comparison, but one side is whole food and the other is a processed product. Every number below sits on that.
The biggest gap comes straight from it: 382 mg of calcium. The mackerel table has no calcium row — not because mackerel lacks calcium, but because you do not eat its bones. The sardine's calcium belongs to the format, not the species: pressure-cooking softens the bones until they are simply edible, and the 490 mg of phosphorus comes from the same place.
Omega-3 runs the other way: 2.6 g against 0.98 g, to the mackerel. Mackerel is graded strong on this site for triglycerides; sardine sits at moderate. Part of the gap is the canning itself, since oil-packing and draining takes some of the fat with it.
Vitamin D also favours mackerel, 16 µg against 4.8 — more than three times.
Protein goes to the sardine, 24.6 g against 18.6, and that too is a consequence of format: heat drives off water, so more flesh fits into the same 100 g.
And 307 mg of sodium appears only in the sardine column, because it is canned. Fresh mackerel has no such row — though salted mackerel adds its own sodium on top.
So: mackerel for omega-3 and vitamin D; canned sardine for calcium you actually swallow, and for a tin you can open and eat. They do not substitute for each other. They are foods in different formats, and the format explains nearly every row in the table.